
Post summary:
- What is a sales quota?
- How to use CRM analytics
- What are the key sales activity metrics?
A sales quota is a target sales reps are set for a specific period (month, quarter, year).
Sales quotas can be set in dollar figures or in the number of goods or services sold.
And if you are managing a sales team, you most likely want to reach you sales quota, right?
In B2B sales, this is what matters most.
Sales people are measured on it. And Sales managers are measured on it.
This is why sales managers spend a lot of time setting realistic goals for their reps. And it’s why sales reps are under a lot of pressure to hit their sales quota at the end of each month.
Typically, reaching your sales goals is a sign that your sales team is performing at its best, your leads are of high quality and your future growth is predictable.
And who doesn’t want that?
However, the reality is that 67% of all sales people miss their quota, The TAS Group claims. And there’s more: 23% of companies surveyed don’t know if their teams achieve sales quota or not!
Reality check
Do you know how well your sales team is doing?
Is your revenue growing every month or have the results started to decline?
If everyone is reaching their sales quota, naturally you would want to set this as the best practice and continue down this path. And, surely, if your sales team is failing, you would want to take measures and improve their productivity.
Either way, first you need to access how your team is performing.
Overcome the knowledge gap with CRM analytics
When it comes to improving your team’s performance, what you want is to be able to rely on your data in making important decisions.
In fact, according to Harvard Business Review, the companies whose decision making is data-driven are more productive and up to 6% more profitable than those that don’t rely on data.
As a sales manager, not only are you responsible for the “big picture” sales strategy, but also for the day-to-day tactics. That is why it’s easy to get swamped with responsibilities and miss the important signs that your team is struggling with their goals.
The sooner you equip yourself with the right tools and data to make important decisions, the quicker you will be able to boost the sales game of your team.
Here’s where CRM can put an ace up your sleeve. Not only will CRM help you engage with prospects and organize contact information and manage sales, it can also help you manage and monitor your sales force.
What metrics really matter
Ideally, the data you get from various sales dashboards and analytics should help you pinpoint issues and streamline your efforts. However, it’s easy to get lost in all this information.
And it can be quite difficult to define what kind of metrics really matter, if your goal is not only to know how your team is playing, but also how to affect their game.
And this is a big sales mistake:
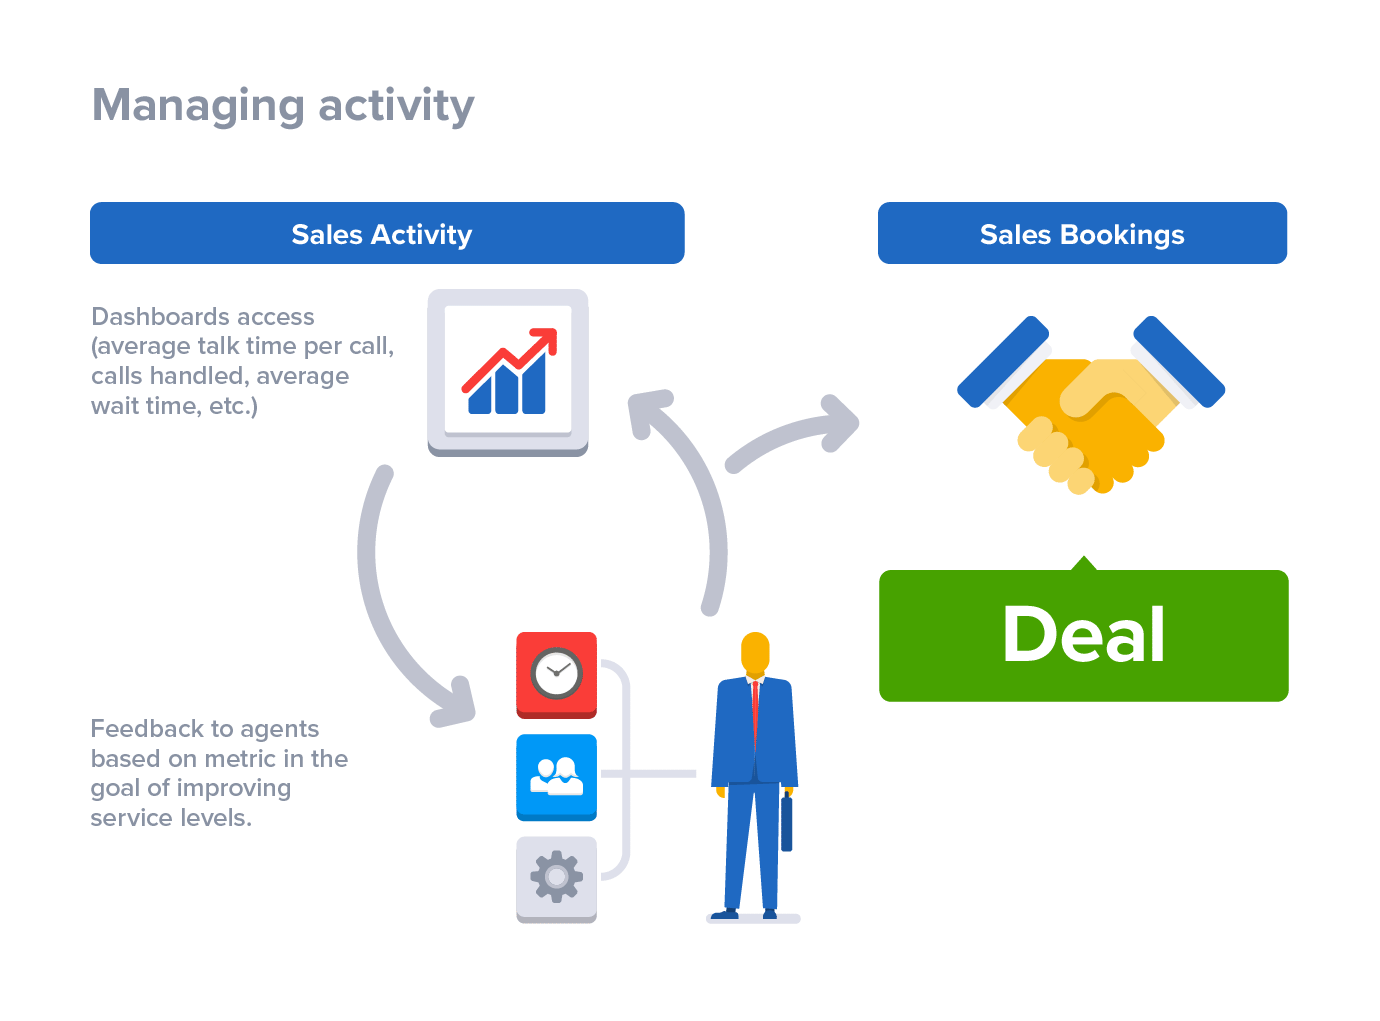
Most sales managers and reps tend to only concentrate on sales results. But, you can’t control results. What you can control though is the activities that affect results!
If you really think of it: sales management is about influencing outcomes. And if you want to use sales metrics effectively, the focus needs to be on those things that are within manager’s control – sales activities.
Along with sales activities, another set of metrics that are strongly recommended are pipeline metrics. Tracking these have a high impact on being in control of how your company’s pipeline is managed.
Here are some sales metrics you can track in your CRM solution to keep your team accountable:
Sales activity metrics
A CRM solution enables you to create activities and track them whenever you need.
Here’ are some activity points to keep an eye on:
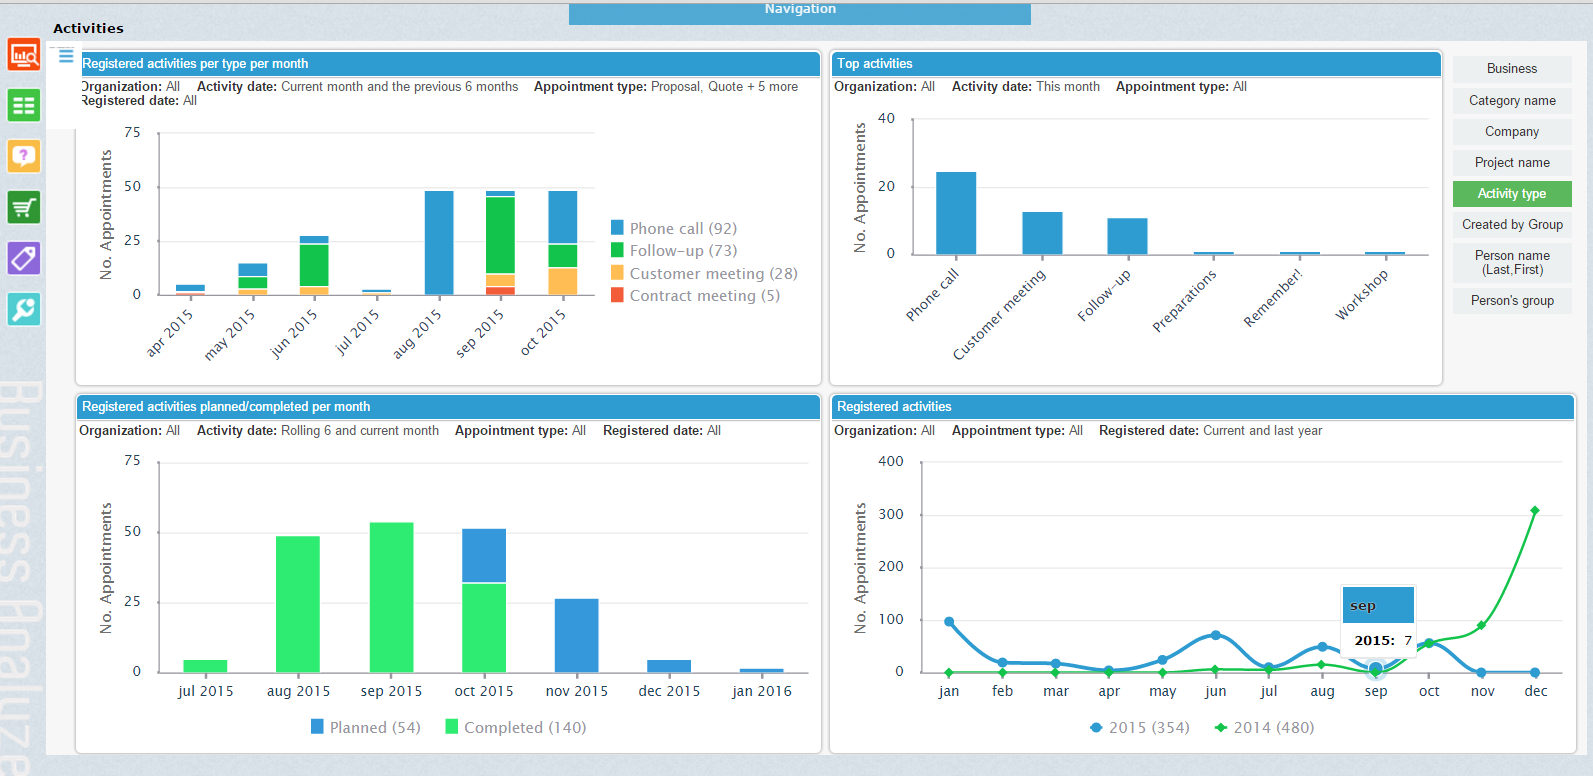
Rate of activities
Track the number of phones calls a sales rep makes and the amount of e-mails sent during a measured period of time. Then, analyze how many of these activities ended up in conversations and responses.
By tracking contacts and responses you can calculate the rate of contact – how many and what type of activities are logged against a lead to qualify it as an opportunity.
According to the Bridge Group and AG Salesworks study, the standard contact rate for sales people is on average 32 sales opportunities for every 1,000 outbound calls.
So, if you see that the contact rate in your team is much lower that is a signal that there is something wrong with the lead hand-off. In this case, you’d better tackle this problem right away by checking if the leads your sales team gets are warm and qualified enough.
The leads your sales team get will ideally have already had one or two touches with your company – whether that’s via your website, opening and clicking emails or engaging with your company on social media. Also, make sure that you have enough data around the lead to compare their profile with your ideal customer and if they fit your target market.
By analyzing activities, you can set some guidelines for your team on how many of them should be made per month to expect results. Moreover, you can monitor what type of activities bring you the desired results.
Rate of follow-up activities
Track the number of follow-up activities and how many of them were needed to move the opportunity to the next stage.
This is a really important metric as following-up is critical in sales success!
According to Marketing Wizdom, 80% of sales require five follow-ups.
And study from Dartnell Corp. states that 48% of sales people already give up after one follow-up!
If your team is not winning enough deals, maybe they struggle with following-up on the prospects?
Contact rates also give you an understanding of how well your team can perform given a certain input. Knowing that, you can set realistic goals for each of your team members and help them if they are under performing.
Sales pipeline metrics
When you set goals for the team, it’s necessary to have a tracking system that will help you keep an eye on how your sales reps are reaching their targets.
Using CRM software, you can actually view your company’s sales pipeline – quickly search through the required periods and see how opportunities are being moved through sale stages.
Here are some sales pipeline metrics that you can track:
Number of open opportunities
Check how many open sales opportunities each rep has in the pipeline.
How many open opportunities a sales rep should focus on at once depends on many factors. The breaking points in this case are deal size, how much time they usually invest into prospecting, qualifying and moving the opportunity forward and their experience level.
If you notice that the number of opportunities is significantly high, there’s a danger that some of them will be left unattended. On the contrary, if you see that sales reps have only few opportunities, they will not make quota. Either way – these are signals that you have to take action.
By knowing this number, you can modify the amount of opportunities each sales rep works with depending on the goals you set for them.
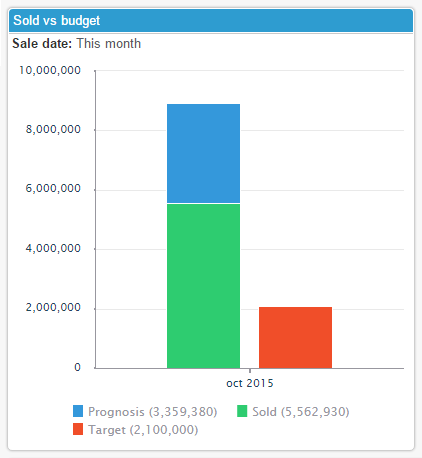
The number of open opportunities per stage also gives you a clear idea if you are going to reach your monthly or quarterly goals. If you see that the number of open opportunities in their latest stage is not enough to hit the target, you might try to push all your team’s efforts on moving some of the deals in earlier stages to forward.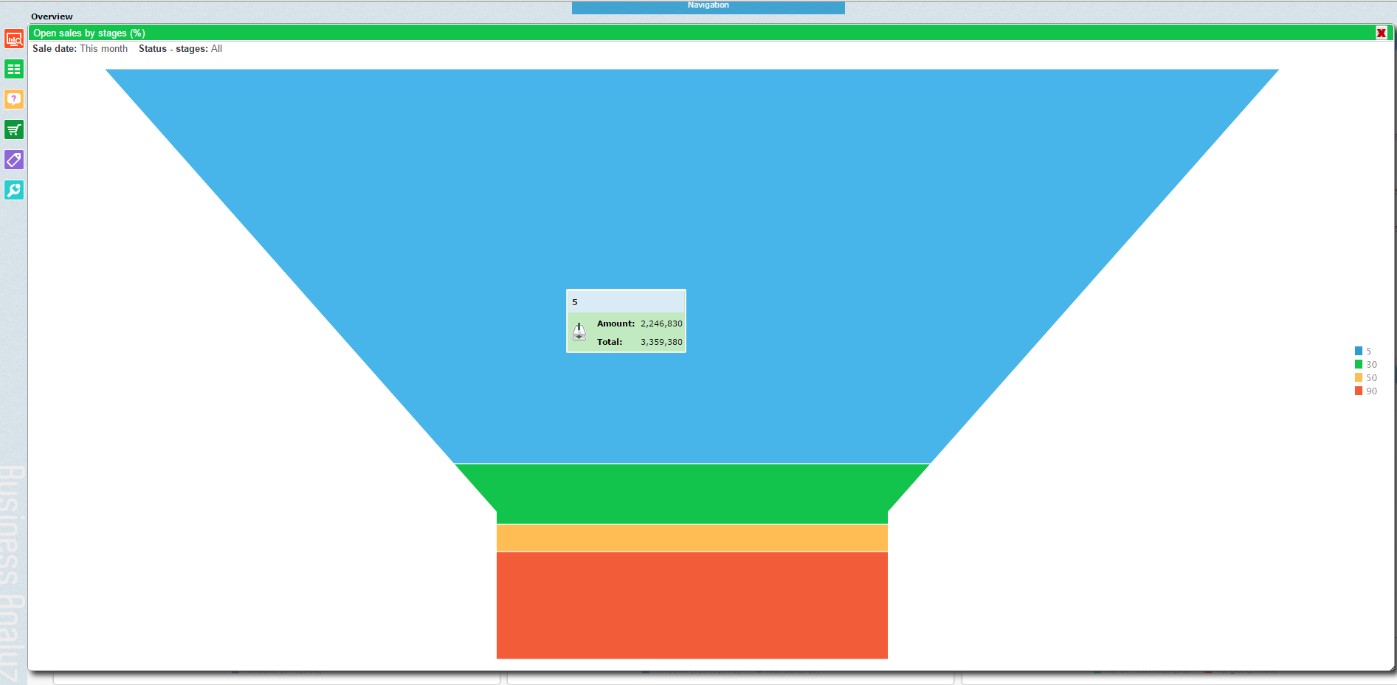
Average number of days in each opportunity stage
By tracking this metric you can get a better idea of which deals are more likely to be closed. For example, if the average number of deals per stage is 14 days, an opportunity that has been lagging in the same stage for 30 days might be less likely to close. With that information you can steer your team’s focus from empty deals to the more promising ones.
Stage to stage conversion rates
This is another metric that will help you find out how your sales reps are doing. If you see that one of them has a dramatic drop-off from the first stage to the second, there’s an alert that some sales coaching and development is required at that stage.
Opportunity to win rate
This shows you how many wins your reps get after moving prospects to the opportunity stage. The metric can help you identify the areas for future improvement. For example, you might have sales reps on your team that are door-openers, but are not so good at actually closing the deals. If so, then you need to help them either get better or move them to a different role.
Remember, you should clearly define two things:
- The entire sales process
- Each opportunity stage in the sales funnel.
This will give you accurate data for all opportunity stages. And when that is done you are well set for an analysis of your team’s performance: where opportunities were won or lost and what issues can be tackled right away.
Conclusion
The only way to continually boost performance in your organization is to measure it and then act on your findings. And by choosing to track your sales team’s performance on a regular basis, you’ll identify strengths, weaknesses, uncover potential opportunities, and prevent potential risks.
Moreover, by analyzing this data you will be able to identify the problems your team faces and provide guidance to both high-performers and under-performers to drive revenue growth.
How do you get your team reach sales quota? Do you have any sales quota tips to share?
Let me know by leaving a quick comment below.
Are you looking for the next step in how to reach your sales quota?
Get started immediately by downloading our free sales KPI guide.